Analysis of the Single Transferable Vote (STV) mechanism at the Scottish Local Government Elections May 2022
I do not attempt to offer any political comment here.
I have added pointers to several good explanations on the Useful Links page.
The Single Transferable Vote (STV) system is implemented in Scotland for the Scottish Local Government Elections. This project comments on and analyses the results of the May 2022 Scottish Local Government Elections. The emphasis here is on the lower-level aspects of this particular (WIGM) implementation of STV.
I believe STV is far more subtle and complex than various sources would tend to suggest. I don’t believe that the typical voter has the necessary sophistication and knowledge to “game” the system.
My own experience of completing the ballot paper on election day led me to consider the difficulties my fellow voters may experience. It is difficult enough ranking up to 10 or so choices given time, comfort and due consideration. However, with the minute or so most voters take to complete the ballot paper – in an unusual environment – with some time pressure – I find it difficult to accept that most voters give due consideration to the ranking. Of course, some voters may have given considerable prior thought to any ranking – but I think they are in the minority.
After some investigation, I discovered much information on the election day eCounting system – and also the data files output by the eCounting system – especially the Preferences Profile data file which documents the ranking sequences made by all the voters in each of the council wards.
I come from a Computer Science background – especially Computer Operating Systems (COS). COS’s necessitate the formulation of performance algorithms to maximise the use of resources e.g. CPU, memory, disk – in a fair and logical manner. My consideration of the STV voting system made me extremely sceptical of the logic behind the election day mechanics of STV. This has caused me to embark on some investigation and research in this area.
My main question here is: Is there really any merit in voters specifying any more than 1/2/3 preferences?
The data I required was, unfortunately, dispersed across the websites of the 32 Scottish Councils. The main data file is called the Preference Profile (BLT) file. This contains the list of preferences made by each voter (in an anonymised fashion).
To answer my questions, I wrote a program (using Python) to decode and summarise the content of all of the Preference Profile files. This involved a very significant amount of data “wrangling”. However, it did allow me to generate various analysis tables and histograms.
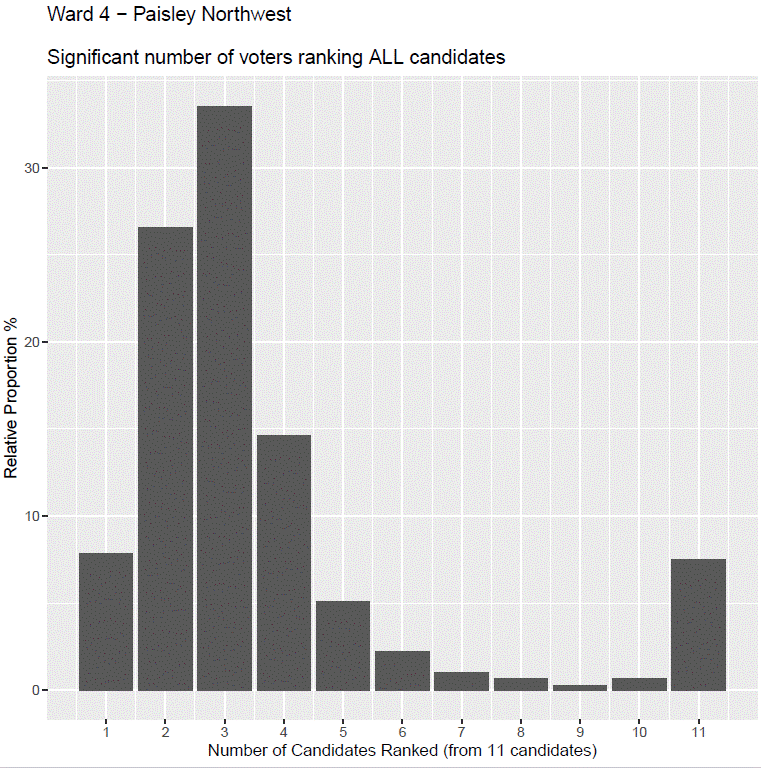
The following histogram is typical. It shows the relative proportion of voters ranking the varying possible number of candidates from one to the maximum number of candidates. The graph appears to consist of two parts – the first part is akin to a Normal Distribution curve – and the second part appears unexpected (to me). What is the explanation of the dramatic count for the number of rankings for the highest number of rankings possible? Here are my thoughts:
- Many voters appear to think they have to apply preferences for many/ALL candidates.
- Do some voters – or groups of voters – believe in some kind of “anyone but ….” mechanism whereby ranking their worst candidate last results in the minimum credit – some kind of “tactical voting”?

Costs and downsides of deep preferences ranking:
If indeed there are issues regarding ranking many candidates, then there are associated costs and downsides:
- Voters may be disinclined to vote at all because of the perceived complexity in completing the ballot paper.
- Voters may make incorrect choices while completing the ballot paper which rather invalidates the entire voting process.
- Voters may overthink the voting process.
- Those voters who attempt to vote tactically – or simply in error – inadvertently promote those other candidates in the middle (or end) of the preference profile pattern. That’s clearly unfair.
- The ballot paper scanning process is more complex.
- Far more ballot papers have to be passed to the Adjudicators and Returning Officer (RO) – this wastes time and may result in misclassified ballot paper images. See Report #1, Appendix 1 for more information.
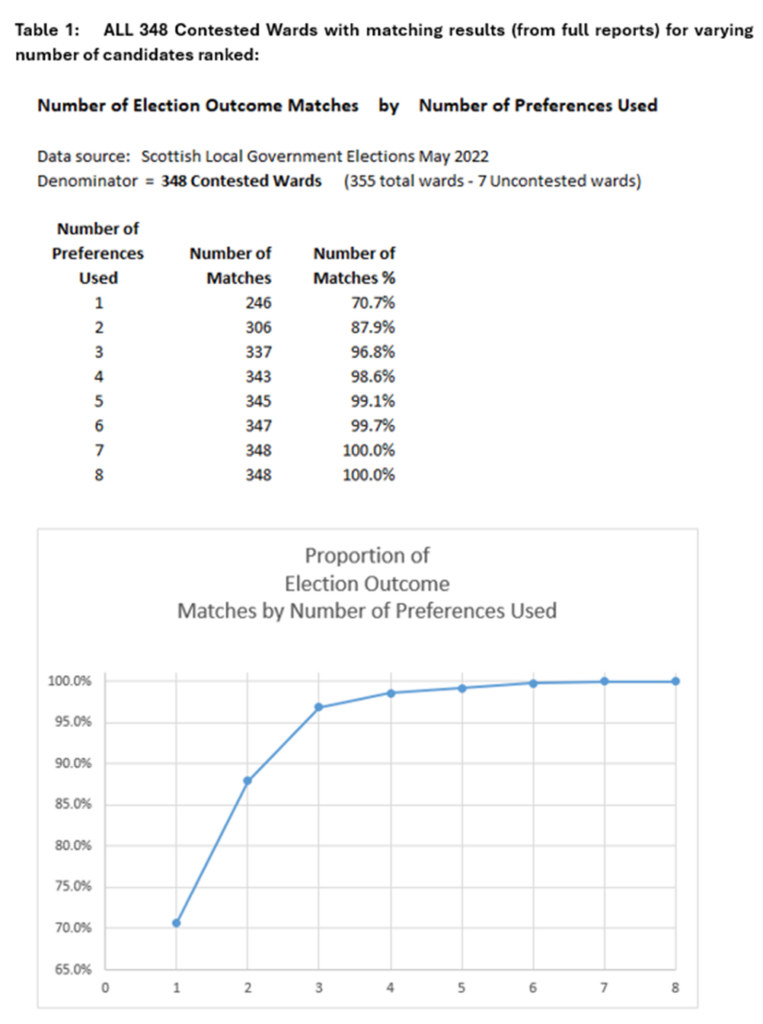
Progressing, we now have the capability to re-run the Scottish Local Government Elections with a varying number of preferences. We can then compare the report outputs of the parameterised election re-run with the original reports to establish matching results. A match occurs when the same set of candidates is elected for a ward – re-run versus original.
The following table lists those matches against the number of preferences:

Example: The 4th line down in the table above: 4 343 98.6%.
The Python program has re-run the election – but now only considering the first 4 preferences.
There were only five mismatches (348 – 343) – and so the matching rate was 343/348 = 98.6%.
There were no mismatches beyond considering only the first 6 preferences. So, for this election, no preferences beyond the 6th had any impact on the overall election outcomes.
Conclusions
I believe that there is significant misunderstanding by political parties and voters in this area – and an over-confidence in the merit of deep preferences ranking. My analysis – over the 348 contested wards – confirms that ranking more than five or six preferences has little or no impact on candidate election outcomes.